Declassified UFO / UAP Document
Velocity and Movement Chart ER-1
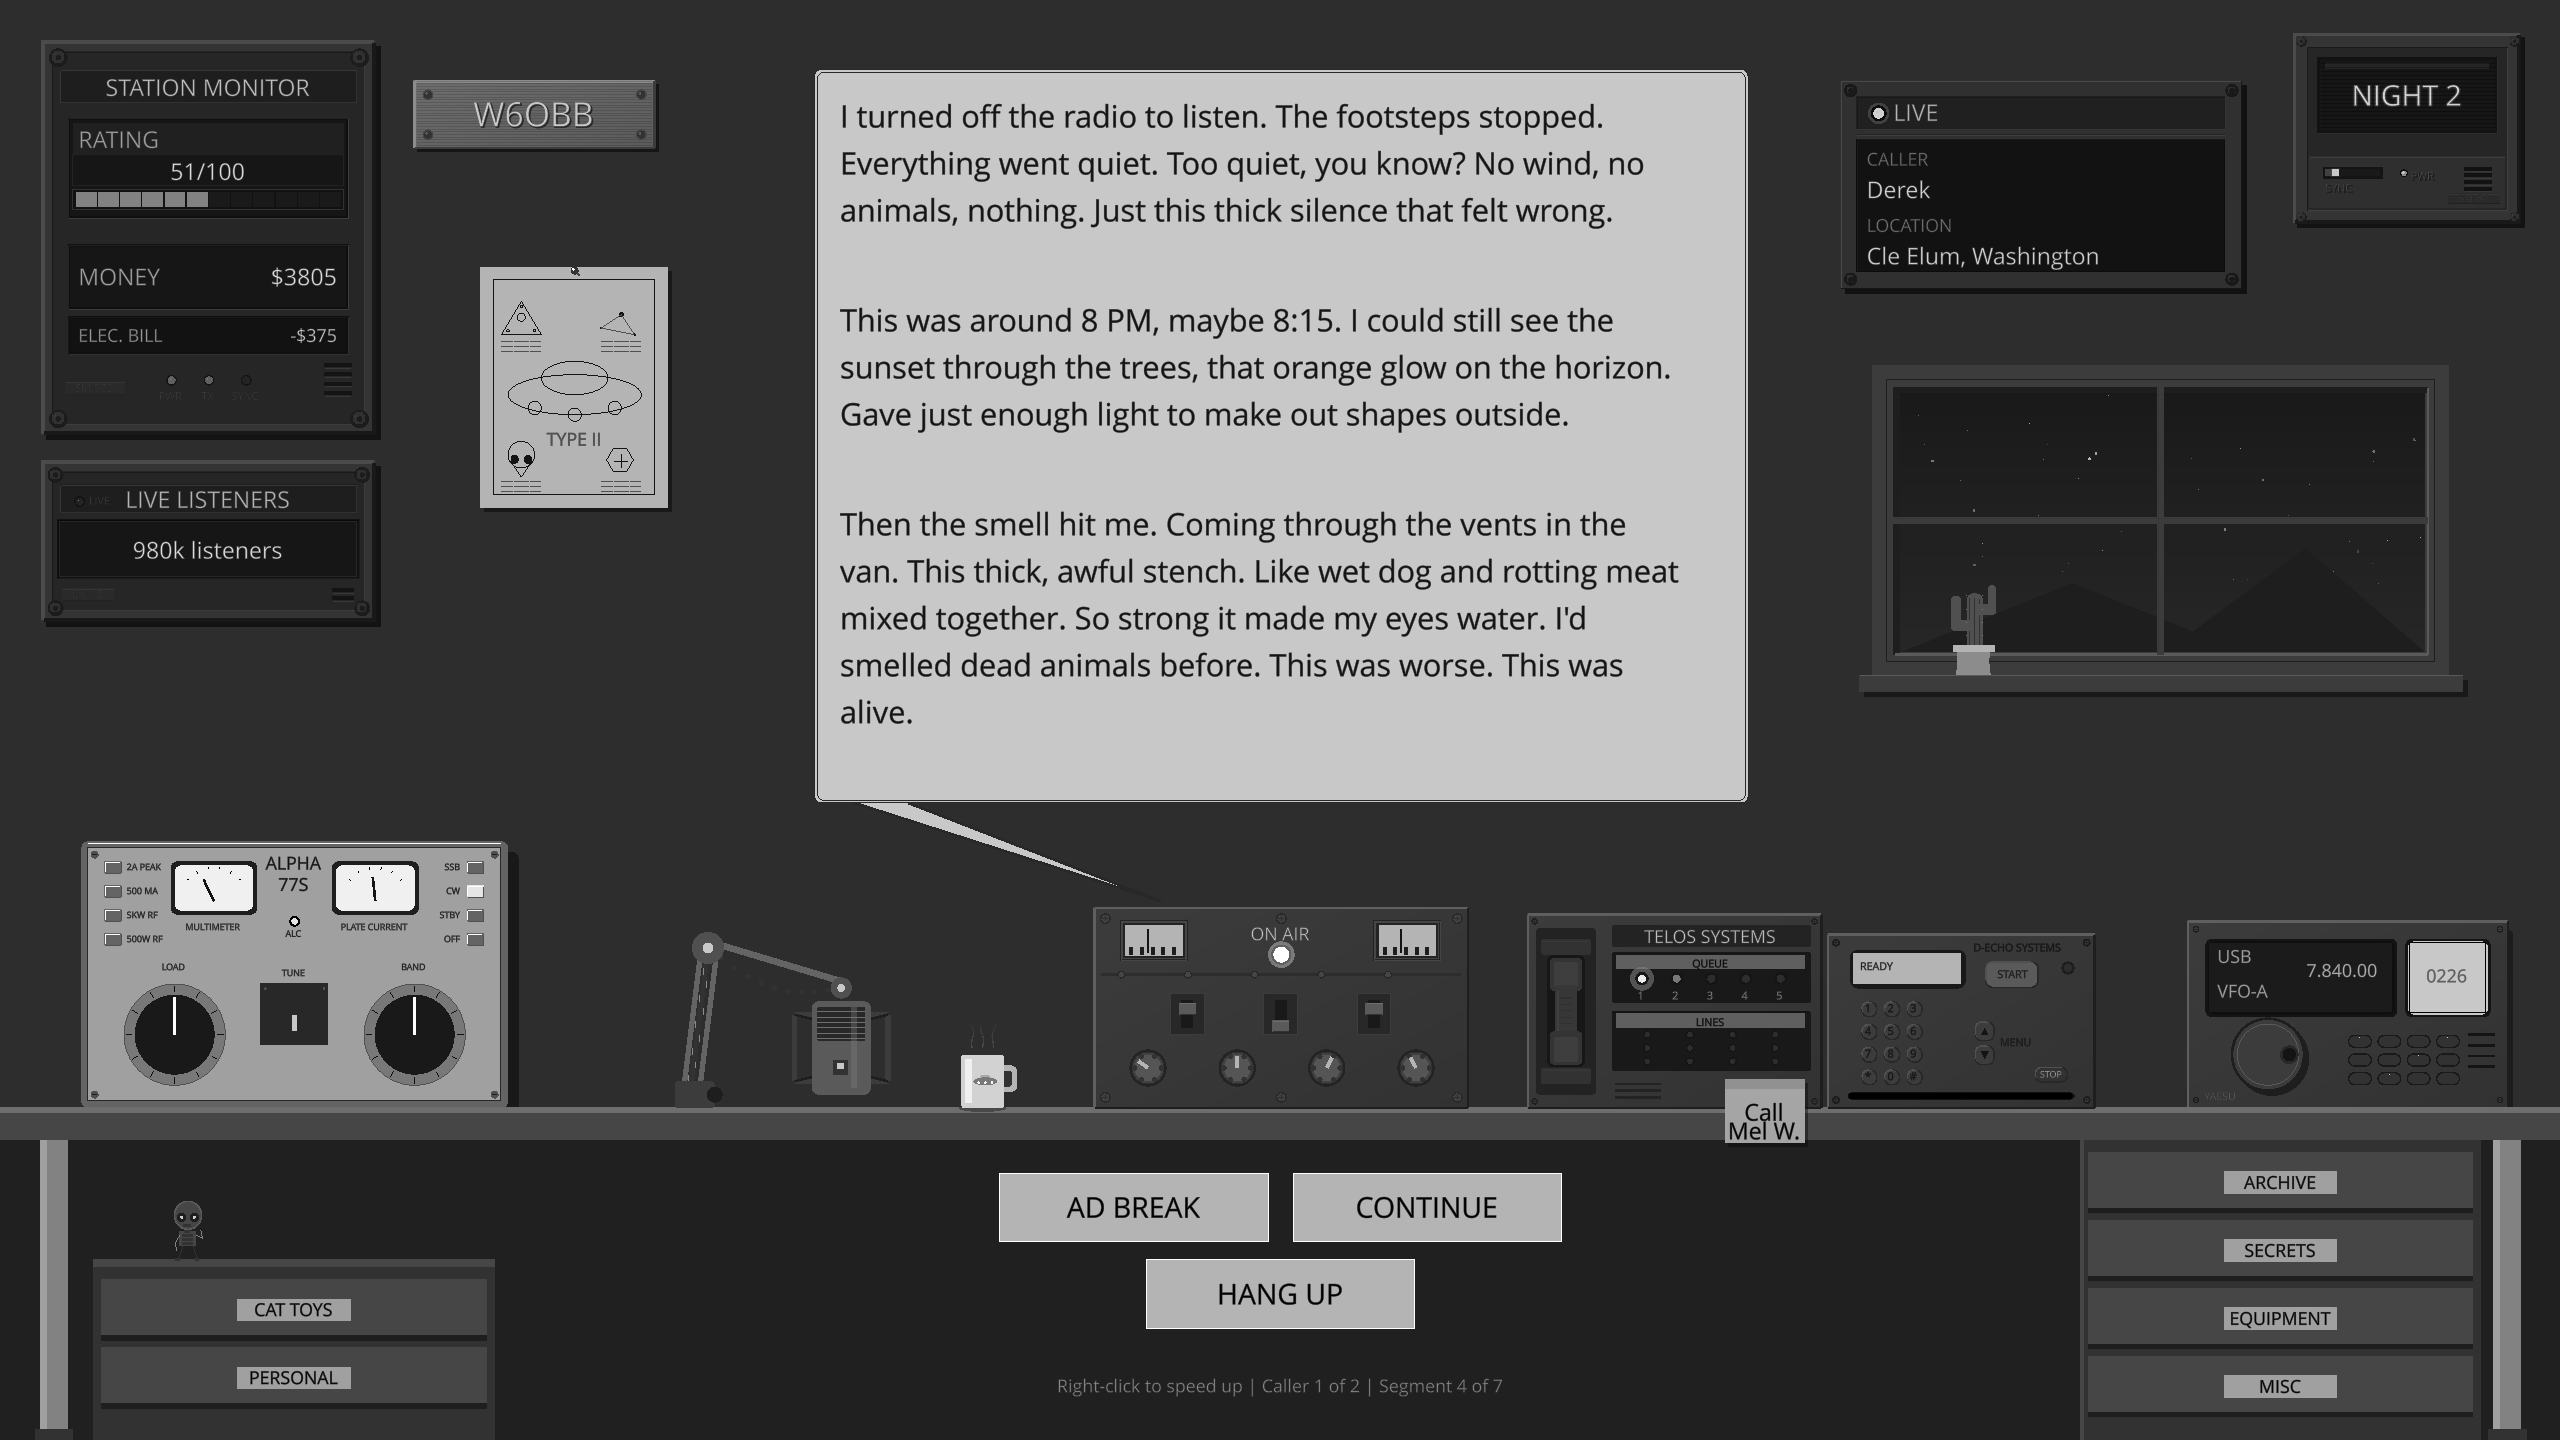
Ever wanted to host your own late-night paranormal radio show?
Across the Airwaves
You're on the air. Callers bring Mothman, Fresno Nightcrawlers, UFO sightings, reptilian autopsies, and whispers about AATIP and Project Blue Book. Every reply shapes how the night goes.

AI-Generated Summary
This document is a 1946 technical chart plotting six movement trajectories with associated velocity data in km/t. It serves as a visual record of tracked motion.
This document, dated December 5, 1946, and identified as ER-1, is a technical chart illustrating the plotted trajectories of six distinct entities or objects. The chart features a central crosshair and a series of colored, winding lines representing movement paths. A legend on the left side of the document correlates these paths to specific velocity measurements in kilometers per hour (km/t). The velocities are listed as follows: T at 75 km/t, U at 55 km/t, V at 60 km/t, X at 95 km/t, Y at 50 km/t, and Z at 85 km/t. The document contains no narrative text, serving strictly as a visual record of movement data.
PDF not loading? Download the PDF directly
Official Assessment
The document provides a visual plot of six distinct movement paths, labeled T, U, V, X, Y, and Z, with corresponding velocity measurements in km/t.